Deducing global presence from social network

Is it possible to figure out if a company has global presence? In this post, I will try to provide some metrics that can help finding that out. One of the details that twitter users can provide about themselves is their language. So, analyzing the followers by language can provide some insight into the presence of that company in various parts of the globe.

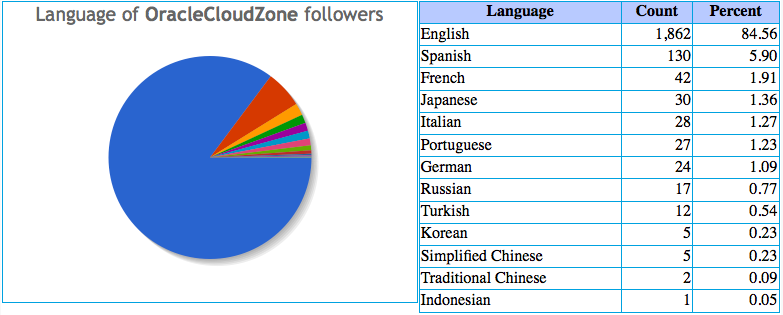
Let’s look at these followers distribution by languages.

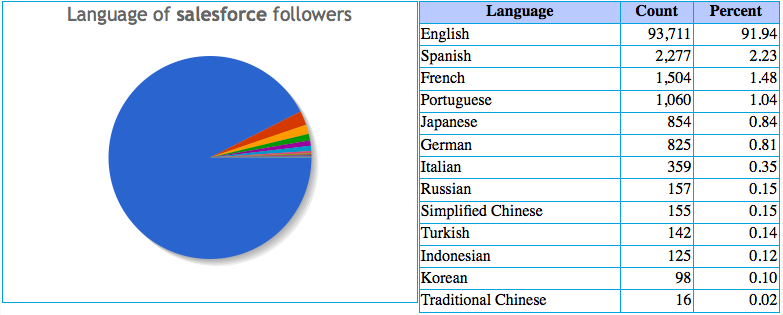
In the above data for salesforce we see that majority of the followers are English speaking. Next highest is Spanish speaking at only 2.23% and then French (1.48%) and Portuguese (1.04%) just above 1%.

In case of Workday, only Spanish is more than 1% in addition to English which is at 96.07% (slightly more than salesforce).

Once again Spanish speaking users come second for Oracle Cloud. What’s also interesting is that Oracle Cloud has a little more global distribution, albeit relatively now. And the reason for this is probably because there are already a lot of followers of the main company.

Statistics don’t always reveal the truth. By looking the data above we can’t immediately conclude that these companies have presence predominantly in USA and may be UK. A lot of internet users and those following technology companies are likely to be fluent in English and hence no matter where they are, they may have their profile setup with English.

But not all hope is lost. In the next post, we will see the same followers list distributed by Location and see how that differs from the distribution by language and how each one indicates the global presence of a company (or a product/service).

Posted in Uncategorized | Tagged , | 2 Comments

How chirpy are your twitter followers – Part 2?

This post is the continuation of the previous post on twitter followers tweet frequency.

The follower of Salesforce with highest number of tweets is CodeOConduct.

The follower of Workday with highest number of tweets is TechZder.

And the follower of OracleCloudZone with highest number of tweets is TheCloudNetwork.

Infact, below is the top 25 for each of the 3.


Salesforce Workday OracleCloudZone
CodeOConduct 353112
DealZOID 351381
LoriMoreno 311073
postjobsnow 308864
iludindovcs 269323
TheCloudNetwork 260676
shoplosgatos 243321
ianwpeters 237428
00ASHLEYMARIE00 234764
TheTechGang 216699
Ciadavitoria 211538
Indiacitys 175316
jashsf 173922
TheWorldNews 158782
Miss_Candis 150066
JATnow 149362
JanSimpson 138071
PatyGallardo 136574
winebratsf 135355
techwatch 132891
ritzconsultant 130829
LOUISFANUCCHIIV 129047
NewTechBooks 126863
sirxl 124796
campus42 122372
TechZader 573136
TheCloudNetwork 260676
shoplosgatos 243321
TheTechGang 216699
ArtMatters2me 159119
RDCushing 138121
humancapleague 134282
iPadTimesJ 104406
georgevhulme 96008
tiger_girl_25 87891
jbowles 78503
rwang0 76553
lisatbds 65364
LollyDaskal 63523
blogging4jobs 61013
Scobleizer 60614
SocialHR 58371
dahowlett 57941
MikeVanDervort 57272
BillBoorman 55910
TalentCulture 54881
CyndyTrivella 53121
NutricionTotal 50053
Marilyn_Res 49108
CloudBlogs 47473
TheCloudNetwork 260676
Scobleizer 60614
YvesMulkers 54569
CloudBlogs 47473
ar1 46886
sangreal333 44857
kazuela 41139
renepkn 37749
CloudExpo 34892
Jason 34427
yukio_saitoh 32840
jesus_hoyos 29693
Metztli_IT 28124
fribeiro1 26703
Mone_Knows 26154
utollwi 25511
SteveBoese 25380
althuwaini 23719
paolapullas 23123
Ulitzer 23055
VirtualizationE 22680
SOAWorldExpo 22063
myfear 21422
AjaxRIAexpo 21202
vigarciatello 20980

Now, let’s see the top tweeters who are common to all there.

TheCloudNetwork 260676
Scobleizer 60614
CloudBlogs 47473
jesus_hoyos 29693
utollwi 25511
SteveBoese 25380
colotweet 13404
DavidLinthicum 9167
rtehrani 9127
TopDevTweets 6901
wrecks47 5004
PHassey 4264
dandarcy 3230
nezproc 3094
joemckendrick 2602
Cloud_Nation 2355
mekncl 2108
PeopleROA 1884
CloudExpert_com 1326
ralucade 1192
LaurenMGill 1115
holgermu 1115
HenneGeek 1026
RunE2E 1023
jeremyharless 995

So, TheCloudNetwork is the one that’s following all 3 and most chirpy. Let’s look a bit more into this twitter account and who are the interesting cloud companies followed by and following them.

Feel free to do analysis on the other chirpy followers. My post would become too long and so will my effort to provide details on all those top chirpers.

Posted in Uncategorized | Tagged , | Leave a comment

How chirpy are your twitter followers?

This is the fourth post in the series of Social Network Intelligence. In  this post, the focus is on how many tweets your followers tweet? That is, do they just have a few tweets or are they mega-tweeters? Before we pour over the charts as in the other posts, let’s first understand whether you want followers to tweet too little or too much. We want followers to engage in conversations so that if they talk about us, other people who follow them will get to know about it. So, we certainly want followers who tweet reasonable number of tweets. Assuming no more than 10 a day would make them accumulate 2.61K a year ignoring the weekends. If they have been there for a few years, we are looking at up-north of 10K if they have been there tweeting for about 4 yrs.

No one likes spam. Similarly, if someone is tweeting hundreds a day, their followers probably would ignore them. At 100 tweets a day, these tweeters would have around 26K and if they have been around, by now they would have more than 100K tweets. It’s probably not worth pursuing getting followers in this range and above. So, what this means is, we want followers who have more than a thousand to less than 10 thousand give or take some.

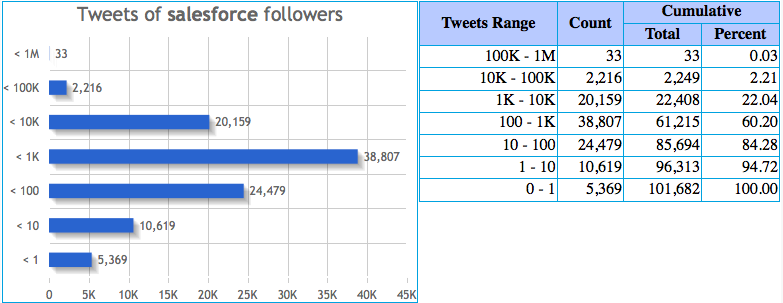
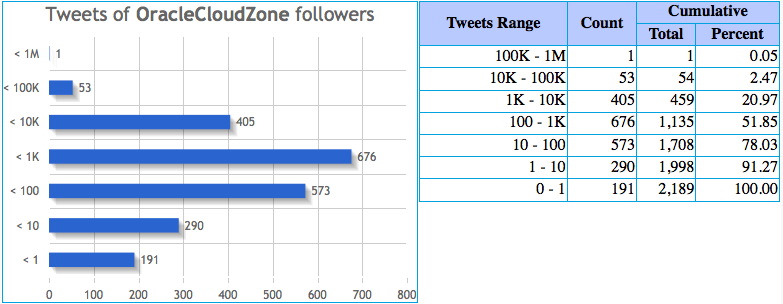
Below we are going to see the followers distribution based on their status (tweet) counts.

In the above charts for Salesforce, they have about 2% who are in the too chirpy range and about 15% who are I live in my own nest range. The percent of followers who are in the range of 100+ to 10K- tweets are 58% (60.20-2.21).

Percent of noisy bunch seems to be similar for Workday. But the number of people not tweeting much is higher for Workday. Their ideal followers are 49.45% (51.93-2.48), about 10% less than Salesforce.

Oracle Cloud numbers are more or less similar to Workday.

Of all the 3, Workday has the highest number of 0 tweeters. These accounts are just there as the observers (Fringe anyone?). In my next post I want to analyze a little more on who are these followers who are in the top and bottom most buckets with actual names to get better insight into why we have followers in those buckets.

Posted in Uncategorized | Tagged , | 1 Comment

Followers’ Followers Are My Followers

As the proverb goes enemy’s enemy is my friend, it doesn’t have to be that way with Social Networks. For companies spending lots of marketing money on Social Networks, one of their main goal is to amass as many followers as possible. However, it’s a good idea to analyze which of your followers can potentially help you get more followers. Most social networks typically have streams or the wall or whatever you call it for each user and the user’s friends and/or followers can see what the user is talking about. So, if you have a follower who has lots of followers, then there is a good chance that more people will become aware of you. This is actually called the network effect. Your network is not just the immediate set of people you follow/friends with but their friends/followers and their network and so on. Obviously, the effect is going to taper of as the degree of separation increases.

It’s usually not practical to analyze the entire network effect due to the lack of information available. The public APIs available from Social Networks typically come with restrictions on the rate of API calls (and for a good reason) and hence everyone other than these networks are constrained by the amount of data available to them.

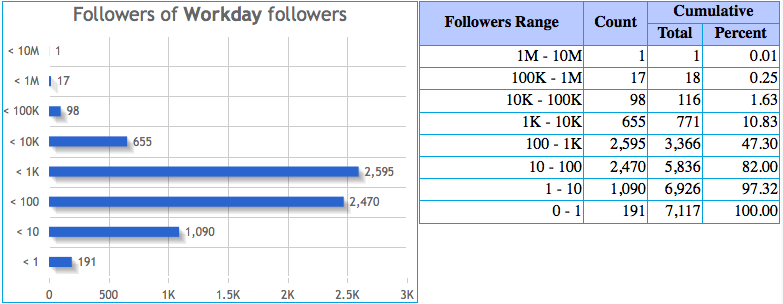
In this post, we will research on the level two followers distribution for the cloud companies we looked at in the previous post on rate of building the social network. Following is based on data from Twitter.

In the above data for Salesforce, we see that they have 3 followers who themselves have more than a million followers! Imagine if just these three followers talk about Salesforce! Salesforce actually has 53.37% of followers who themselves have at least 100 followers.

The above data is for Workday. They just have one follower with more than a million followers. Similarly, they have less than 50% of people with more than 100 followers. However, the percent of people with more than 1K followers is more than that of Salesforce. This distribution of level 1 followers by their own followers provides insight into the overall network effect. That is, if two companies have similar number of followers, but if one of them have more followers with higher number of followers, then that company is likely to have a larger reach.

Finally, this is the level 1 followers distribution for Oracle Cloud Zone. They are yet to get twitter followers who have more than a million followers. At present they also have only 40% followers with 1K or more followers. Again, given the time frame these three accounts have been on twitter, it’s not an apples to apples comparison, but it should provide insight to each of these account managers how their network is growing.

Given the network effort, should a certain percent of the budget be dedicated towards the high profile followers who themselves have lots of followers? May be like 40% of the budget towards top 10% followers? I just play with data, not actually manage any such accounts. So, would like to hear from others who actually do that as a job and what they think of such type of analysis on their network.

Posted in Uncategorized | Tagged , , | Leave a comment

Rate of building the Social Network

This is the second post in the series of Social Network Intelligence.

Companies are spending a lot of marketing money and most companies now have a link to Facebook and Twitter just like they have links to About and Products/Solutions pages. If you don’t, make sure you get the right marketing guys.

Once the companies start focusing on promoting themselves on these Social Networks, they need to constantly measure how they are doing on the networks. It’s not a one time investment and done deal. Depending on the size of the company, it may require dedicated resources either for all the top social networks or even one or more just for each network.

A set of simple but high-level metrics to find out how someone is doing their marketing on the social network front can be

  • the rate of friends
  • the rate of followers and
  • the rate of tweets (conversations)

Let’s take for example these metrics for a couple of Cloud companies. Below are the details for Salesforce, Workday and Oracle Cloud.

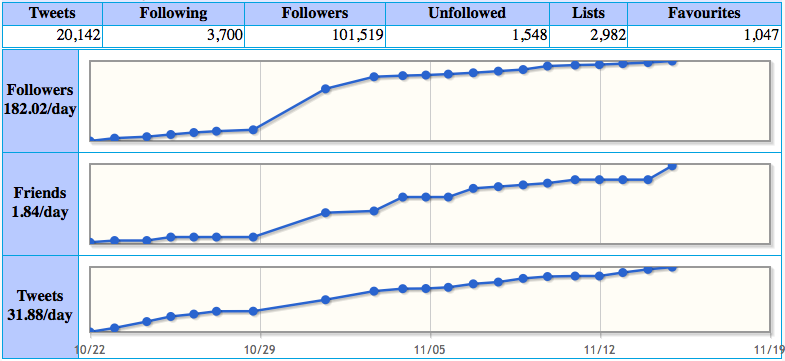
The above chart for Salesforce indicates that they send about 32 tweets per day on average. They get 182 followers a day on average (although, the data is skewed due to some event that happened towards end of October that got them lot of followers and friends).

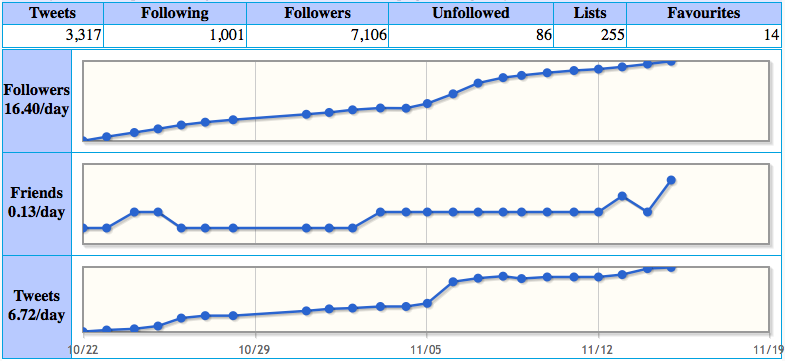
Workday, being relatively new compared to Salesforce (atleast in terms of going public) is doing OK with respect to the number of followers it is amassing every day.

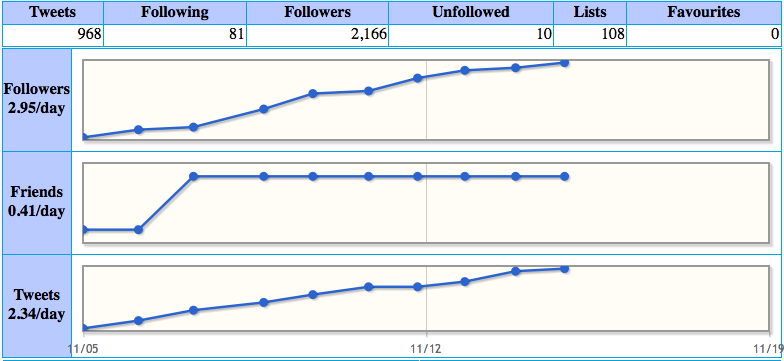
The final chart is for Oracle Cloud. Note that some large companies not only participate on several social networks, they also have specialized social network account/handle for their individual products or offerings. Oracle Cloud Zone on Twitter is a good example of that. As this is relatively new, at present the rate of followers, friends and tweets is relatively low compared to the other two. With time these numbers should drastically increase, although it’s not clear whether having multiple twitter accounts will segregate the user base. Of course, that may not actually be bad as it provides more focused user base.

BTW, these pretty charts are possible only because Twitter graciously shares it’s Social Network data via JSON APIs. The fact that their API version 1.1 forces authentication is a separate issue that I might write a blog post upon OAuth one day regarding the it’s limitations I have bothered to look into after starting to use Twitter API.

Follow the blog to see more interesting metrics that I am going to present in subsequent posts!

Posted in Uncategorized | Tagged , | 1 Comment

Social Network Intelligence

As per wikipedia, “A social network is a social structure made up of a set of actors (such as individuals or organizations) and the dyadic ties between these actors. ” These actors have several attributes and analyzing the relationships using these various attributes provide better insights on the network as a whole or about an individual actor.

Only a handful of companies have the rich social networks and the associated data to be able to analyze and identify interesting patterns and metrics on a mass scale. Some of these are LinkedIn, Facebook and Twitter. Each of these networks capture the relationships differently. They even differentiate the actors differently. For example, twitter accounts can be individuals or organizations. But on LinkedIn, the individuals and the organizations are separate entities.

Social Network Intelligence can be based either on static relationships alone or the dynamic content. Let me explain what I mean by this. Social Network is not just about having friends and followers. Those relations actually exist for the purpose of engaging in conversation. Hence, intelligence based on the static relationships alone provides more of a high-level, non-realtime intelligence while intelligence based on the conversations provide a dynamic and real-time intelligence. It’s not that one is better than the other. Users of this intelligence just have to understand that there these two types and which one is useful for the task at hand. For example, to know about the employees of a company, the conversations are not really needed.

Over the next several posts, I plan to focus on the intelligence based on the social network graph and the attributes of the actors in the network without regards to their conversations. Further, the topics are going to focus on analyzing the network with respect to a specific actor as opposed to analyzing the network as a whole. This is because usually each actor is interested about their own sphere of influence or those of their friends, relatives, customers, competitors and partners.

I am also going to make use of the Twitter as the social network. We will look into simple metrics such as “rate of accumulation of friends” and “rate of tweets” to more complex metrics such as “who are your most influential followers” and “what kind of global presence a company has”. Stay tuned!

Posted in Uncategorized | Tagged | 1 Comment

Hybrid Car Savings

Today I had a conversation with someone at work about buying a regular car vs a hybrid. He was of the opinion that the difference in prices don’t justify going for a Hybrid unless you drive 150K miles. Wanting to know if that’s correct or just out of curiosity of the various parameters, I tried to find out if there is a formula that’s possible to come up with.

I am not an experts in cars and so my assumptions might be completely wrong. I am assuming that the savings are measured purely in terms of the savings in the gas. So, let’s derive the formula.

Say, the difference in price between a standard car and it’s hybrid counter part is $P. Say, you have to drive D miles before breaking even. Say, the mileage (MPG) for the standard vehicle is S and for hybrid it’s H. Let’s assume the cost of a gallon oil is $G. Now, we have all the parameters.

The amount of gas required to travel D miles by standard car is D/S

The amount of gas required to travel D miles by hybrid car is D/H

So, the savings is (D/S – D/H) * G

Equating the above to the premium paid, P, we get

D = P*H*S/(G*(H-S))

Now, let’s go with some real numbers.

Premium = $4000.00

S (MPG) = 25

H (MPG) = 42

Price of a Gallon = $4.5

Then, distance D for breakeven = 4000*25*42/(4.5*(42-25)) = 54,902 miles. If the gas price is $4 a gallon, it would be 61,765 but if it were increased to $5, then it’s going to be 49,412 miles. So, definitely not in the range of 150K miles.

Of course, at this time the assumption is that the battery won’t go bad, there is no maintenance costs associated purely with the Hybrid part of the technology which may or may not be correct.

Of course, for those who are green conscious may be ready to spend a few hundred dollars extra for the greater good. If it’s beyond that, it probably doesn’t make sense.

Posted in Uncategorized | Tagged , | 1 Comment

2% can solve 25% of the problems

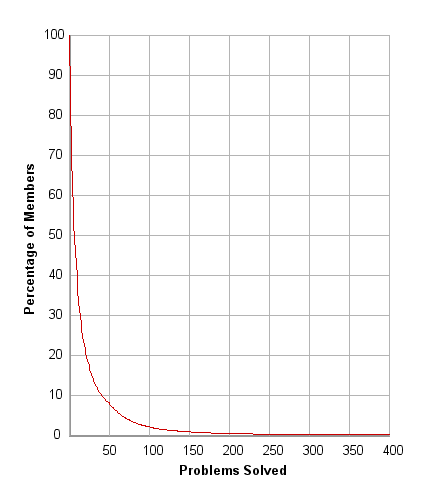
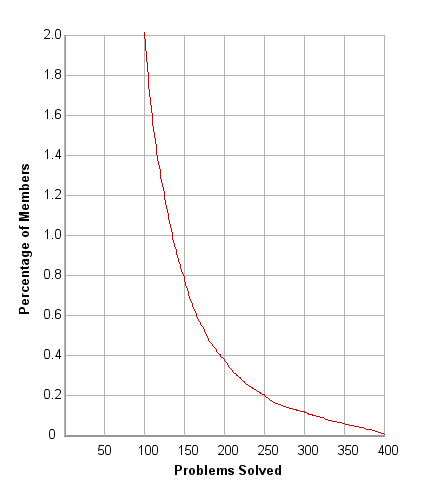
Weekend was a milestone for Project Euler which published the 400th problem. Recently a new feature has been added in the Problems Solved section that displays the graph of how many people solved a certain number of problems. As per the graph, the number of people who solved about 100 problems which is 25% of total problems is 2%.

My observation of solving Project Euler problems was that the time required to solve the problems was sort of exponential as the number of solved problems increases.  Now, this graph confirms the exponential nature of the complexity.

If you zoom further into the graph below the 2%, solving about 35 more problems to 135 brings a person into the top 1%. Solving about 200 problems brings to the top 0.4%, 250 problems to 0.2% and about 300 problems into 0.1%.

The live graphs can be found here and here.

As of this writing there are 12 people who have solved all the 400 problems representing a mere 0.005%.

With a total of 260,186 registered users, I think the above statistics are a good sample representing the entire population. If you are new to Project Euler and like challenging Math and Programming puzzles try to find out how far you can go in the curve.

Posted in Uncategorized | Tagged , , | 1 Comment

Learning Mathematics

Growing up, Mathematics was one of my favorite subjects. And I was reasonably good at it. Nothing to be proud of though, just that it’s a subject I wasn’t afraid of and I could easily understand the difficult concepts and score good marks.

Living in the US I keep hearing how Mathematics is a tough subject for many kids and it’s even considered uncool. Of course, there are many great Mathematicians in the US but I am not talking about the exceptional cases. For an average student it’s probably a daunting subject in any country.

Now I don’t have to deal with Mathematics at work. However, I came to know about the website Project Euler a little over 3 yrs back and given my liking for both Math and Algorithms, I have spent a lot of time solving the problems on the website. In the process, I also got a chance to revisit many math concepts.

It’s in this context, I have been understanding how many things I learned during 6th to 12th could be used in real-life world to figure out interesting things. Two such examples are Matrices and Polynomials. As a student, matrices were nothing more than some entities that followed certain rules for multiplication and addition.

No one told me how matrices can be used to represent recurrence relations and how matrix exponentiation can be used to compute the recurrence relations very very fast (in the order of log(n) , which is understandably not something a pure mathematician would probably care about or that’s not the age to talk about complexity of an algorithm).

And what about Polynomials? We just learned about quadratic equations and how to solve them by factoring to get the roots. But beyond that? What sort of real-life problems can they solve? Recently, I came across a problem where a set of dice are thrown and their sum follows a certain distribution and the question asked how to create a different set of dice that has the same probability. Now this is not a very easy problem to solve. Take two standard dice (that each gives a value of 1 to 6). Then the sum distribution follows: (2,1) (3,2), (4,3), (5,4), (6,5), (7,6), (8,5),(9,4),(10,3),(11,2) and (12,1). That is, it’s possible to get the value 10 in 3 ways: {4,6}, {6,4} and {5,5}. Computing this distribution of the sum is not at all difficult. But figuring out another set of dice that provide the same distribution is not easy. Of course, in case of just 2 dice, it’s actually easy to bruit-force the answer. But the problem I worked on involved a total of 7 dice each with a different number of faces. And the problem asked to find a set of 4 dice whose sum gives the same probability for their sums and each with 120 faces but with values ranging from 1 to x where x is much smaller than 120 (and the actual value of x is known). Let me just say, this problem is not something that can be bruit-forced. Further more, it’s a problem that can’t even be solved by a set of equations.

However, if one understands how a dice can be represented as a polynomial and how a set of dice can be represented using these polynomials, then the problem becomes very easy. I agree that if one doesn’t understand polynomials itself, how can they understand more advanced concepts. But while complexity is not something every one wants to deal with, at least the subject can be made interesting with such examples. Bright students who can follow will cherish these interesting ways of using the math they are learning. Average students, while can’t understand the advanced math, can probably appreciate that it’s possible to solve such complex problems using the building blocks of mathematics they are learning.

Personally, this aspect of how some of the concepts learned as a school going student can be used gives a great pleasure which I would have at least appreciated, if not understood, back in those days. That time I had teachers, but they never told me these things. Now I don’t have a teacher, but I have the Internet to learn! All that’s required is the desire and curiosity. Of course, I am not advocating every adult to go start relearning their childhood courses. But many of us as parents can try to steer our kids towards such interesting aspects of the things they study.

I was initially thinking of calling the title of this post as “Teaching Mathematics”, but then I wanted to give the student’s perspective and what the student can do, rather than making this as a responsibility of a teacher (as many teachers may not be capable of this as they were once students too or they may not have so much time and energy to go above and beyond what needs to be covered in the classrooms).

I know some of you might be curious to know the actual solution for the dice problem. The puzzle is still open for solving and hence I am going to wait out a few days. Later I will come and update this post on how to go about solving it with polynomials.

Update: OK, here is the link to the dice puzzle and the solution.
Posted in Uncategorized | Tagged , , | 1 Comment

Numerical Integration Of A Recursive Function

I never thought I would pen down something about as dry as this one (may be making my childhood Math teachers proud :)).

Few days back I was solving a puzzle that required precisely this. It required that I do integration of a recursively defined function. The function is something like this

f(x) = 1 + integrate (x-y)*f(y)*dy,y,f,x

Here I am using the notation of integration as per Wolframalpha. What it says is, integrate the function (1st parameter), w.r.t the variable (2nd parameter) from a (3rd parameter) to b (4th parameter). As can be seen, f(x) is dependent on the integration of the same function for lower limits (f -> x).

The problem asked for a high precision (at least 10 digits after decimal). That had been a bit of a challenge. The above function can be thought of as a variation of finding the area under the curve f(x). That is, f(x) is 1 + area under the curve of g(y) where g(y) = (x-y)*f(y).

I tried two ways and both failed to provide the required level of precision. First method was to just divide the curve into small strips and do the standard numerical integration but building the values of f(x) from f gradually one at a time. It provided a precision up to 7 to 8 digits but I needed to use a very small dx and when I further reduced the size of dx it again started deviating from the answer. But changing from double to long double worked out well but still couldn’t offer the desired precision.

Part of the problem is, this function grows very steep initially (near f) and then gradually tapers off. So, the high precision required is initially and not later on. So, using the same dx is not really required. That means, the dx needs to be adaptive. So, changed the algorithm to keep using different dx at different x till a desired precision is obtained. This did increase the precision but still 10 digits precision had been elusive.

Finally, I tried a 3rd approach. Rather than building up the f(x) values gradually one at a time using the previous values, I started each value with a default value of 1 and then refined the values using a similar computation of area under the curve. Of course, since I now assume I have values of all the points, I could use the value of a point in computing itself! So, instead of using the beginning value of each dx and multiplying by dx, I took the mean of the start and end values of the dx and x itself to be at the middle of the dx. This worked surprisingly well and only after two iterations. Also, rather than needing 10^10 or more delta parts, I just needed 4*10^6.

After I solved the puzzle and looked at the solution, some people managed to derive the actual function f(x) and substituted the value of x and got the answer. So, no numerical integration. That’s smart of them. But in case such a closed form function is not possible, I think this is a good numerical integration method that can be adopted for a very good precision.

Posted in Uncategorized | Tagged | Leave a comment