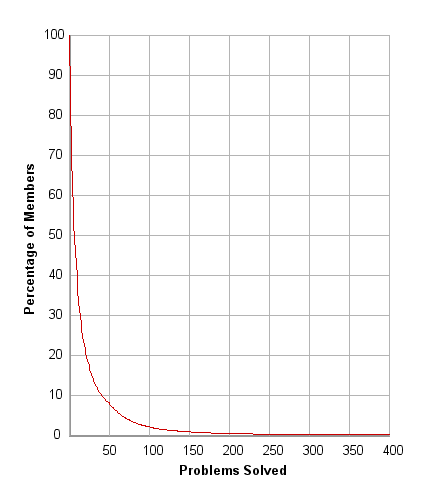
Weekend was a milestone for Project Euler which published the 400th problem. Recently a new feature has been added in the Problems Solved section that displays the graph of how many people solved a certain number of problems. As per the graph, the number of people who solved about 100 problems which is 25% of total problems is 2%.
My observation of solving Project Euler problems was that the time required to solve the problems was sort of exponential as the number of solved problems increases. Now, this graph confirms the exponential nature of the complexity.
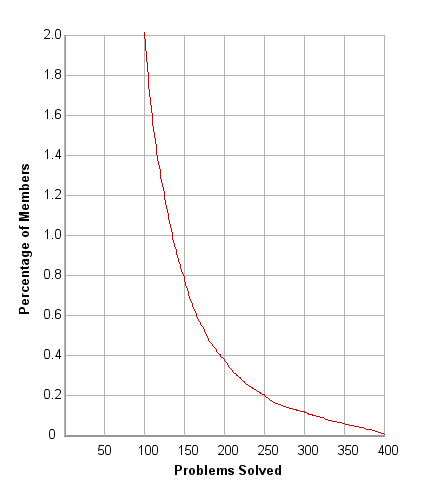
If you zoom further into the graph below the 2%, solving about 35 more problems to 135 brings a person into the top 1%. Solving about 200 problems brings to the top 0.4%, 250 problems to 0.2% and about 300 problems into 0.1%.
The live graphs can be found here and here.
As of this writing there are 12 people who have solved all the 400 problems representing a mere 0.005%.
With a total of 260,186 registered users, I think the above statistics are a good sample representing the entire population. If you are new to Project Euler and like challenging Math and Programming puzzles try to find out how far you can go in the curve.


Amazing stats!!! Just found Project Euler…. I think I will have fun… 🙂
Amazing blog…